Practice AHL 4.19—Transition matrices – Markov chains with authentic IB Mathematics Applications & Interpretation (AI) exam questions for both SL and HL students. This question bank mirrors Paper 1, 2, 3 structure, covering key topics like core principles, advanced applications, and practical problem-solving. Get instant solutions, detailed explanations, and build exam confidence with questions in the style of IB examiners.
Paper
Level
Question 1
HLPaper 2
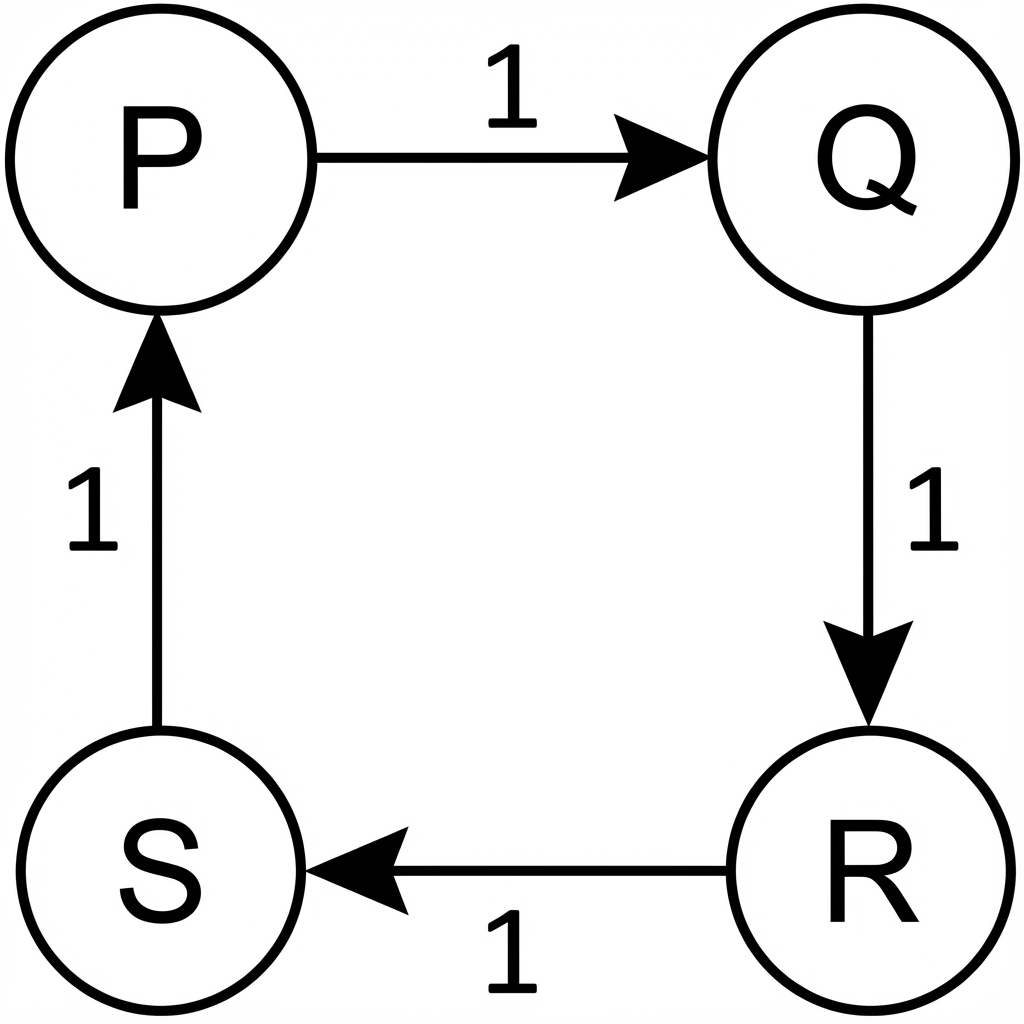
A network of paths connects four nodes, A, B, C, and D, as shown:
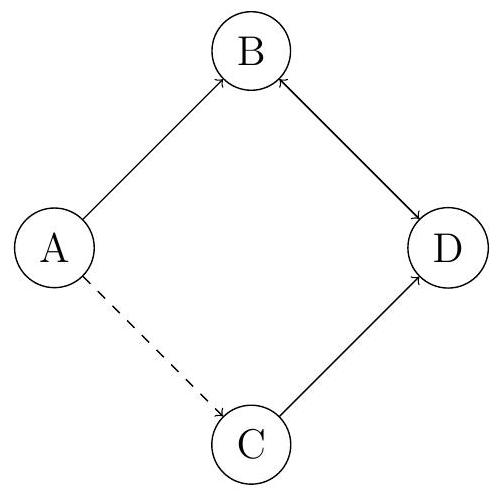
Dashed lines indicate paths that are twice as likely to be chosen.
1.[3]
Construct the transition matrix for a particle moving between the nodes.
2.[3]
Find the steady-state probability distribution using a graphic display calculator.
3.[2]
Explain one limitation of this model in the context of path selection.
Question 2
HLPaper 1
A system transitions between states , and with transition matrix:
1.[3]
Find an eigenvector corresponding to the eigenvalue .
2.[2]
Using Part 1, determine the long-term probability of being in state .
Question 3
HLPaper 2
A zoo has three habitats, H, I, and J, connected as shown in the diagram below:
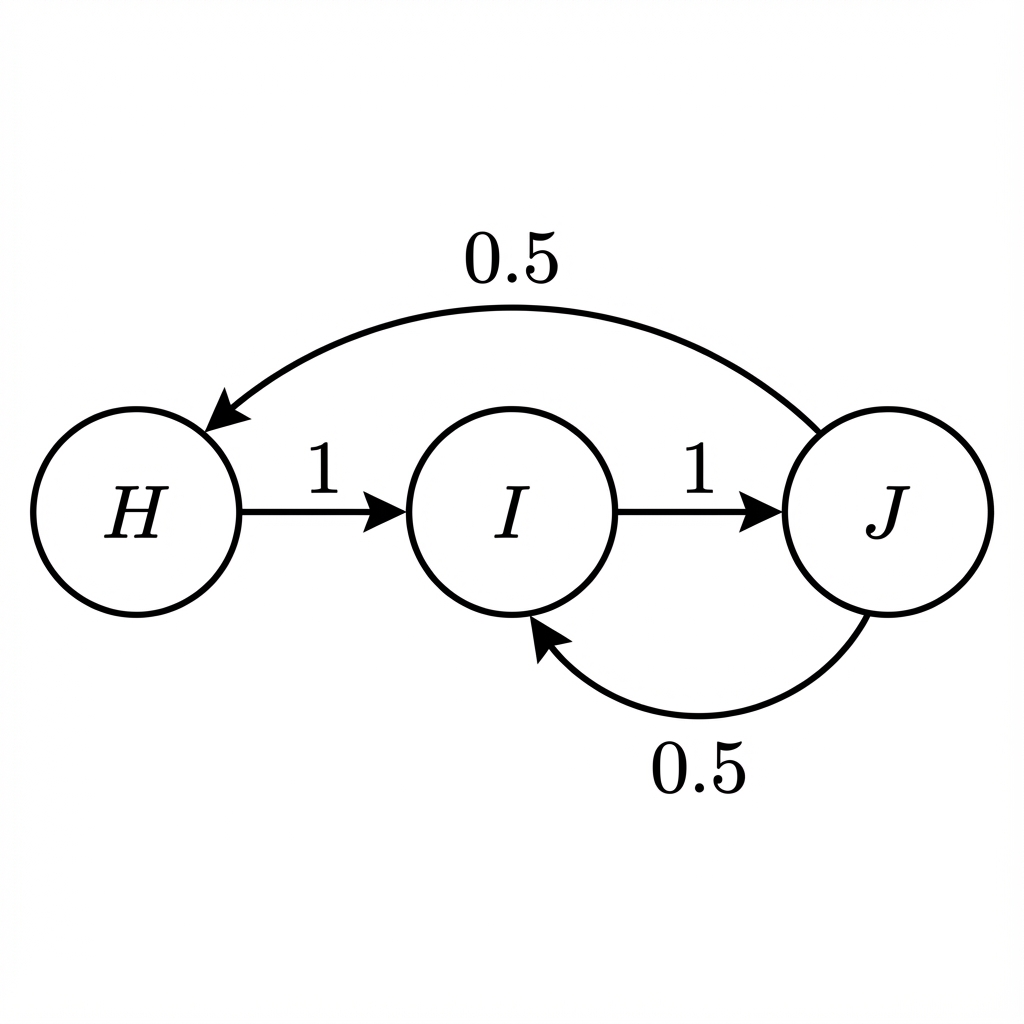
An animal moves between habitats with equal probability for each available path from its current habitat.
1.[3]
Write down the transition matrix, , for this system.
2.[3]
If the animal starts in habitat H, find the probability it is in habitat J after two moves.
3.[2]
Find the long-term probability of the animal being in habitat I.
Question 4
HLPaper 1
A Markov chain models a process with states , and , with transition matrix:
1.[2]
Verify that is a valid transition matrix.
2.[5]
Express as , finding matrices and .
Question 5
HLPaper 2
John likes to go sailing every day in July. To help him make a decision on whether it is safe to go sailing he classifies each day in July as windy or calm. Given that a day in July is calm, the probability that the next day is calm is $0.9$. Given that a day in July is windy, the probability that the next day is calm is $0.3$. The weather forecast for the 1st July predicts that the probability that it will be calm is $0.8$.
1.[3]
Draw a tree diagram to represent this information for the first three days of July.
2.[2]
Find the probability that the 3rd July is calm.
3.[4]
Find the probability that the 1st July was calm given that the 3rd July is windy.
Question 6
HLPaper 2
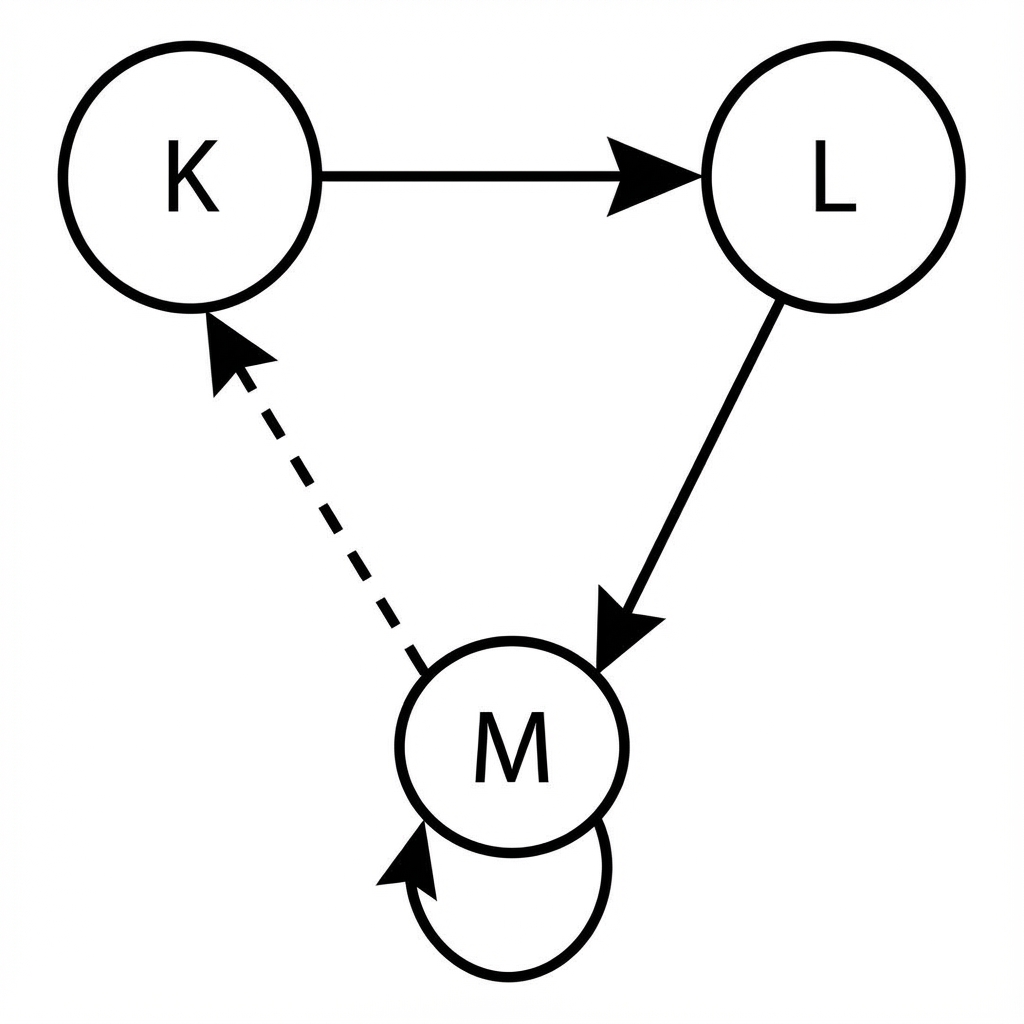
A game involves a player moving between states , and , with transitions shown in the following diagram:
The player moves with equal probability to each connected state.
1.[3]
Write down the transition matrix for this game.
2.[3]
Find the steady-state probability vector .
3.[4]
Find the minimum number of moves for the player to be at least certain of reaching state , starting from state .
Question 7
HLPaper 2
A wildlife reserve is tracking the movement of a certain species of bird between three regions: Region X, Region Y, and Region Z. Each month, 20% of the birds in Region X move to Region Y, 10% move to Region Z, 15% of the birds in Region Y move to Region X, 5% move to Region Z, 25% of the birds in Region Z move to Region X, and 10% move to Region Y.
1.[2]
Construct the transition matrix for the movement of birds between the three regions.
2.[3]
If initially there are 100 birds in Region X, 150 in Region Y, and 200 in Region Z, calculate the distribution of birds after one month.
3.[2]
Draw the transition diagram representing the movement of birds between the three regions.
Question 8
HLPaper 2
A biologist models animal migration between three regions, , and . The transitions are represented in the following diagram, where dashed lines represent paths that are twice as likely as solid lines originating from the same region.
1.[3]
Construct the transition matrix for this model.
2.[3]
Find the steady-state distribution for the animal's location.
3.[2]
If the animal starts at region , find the probability it is at region after exactly two moves.
Question 9
HLPaper 2
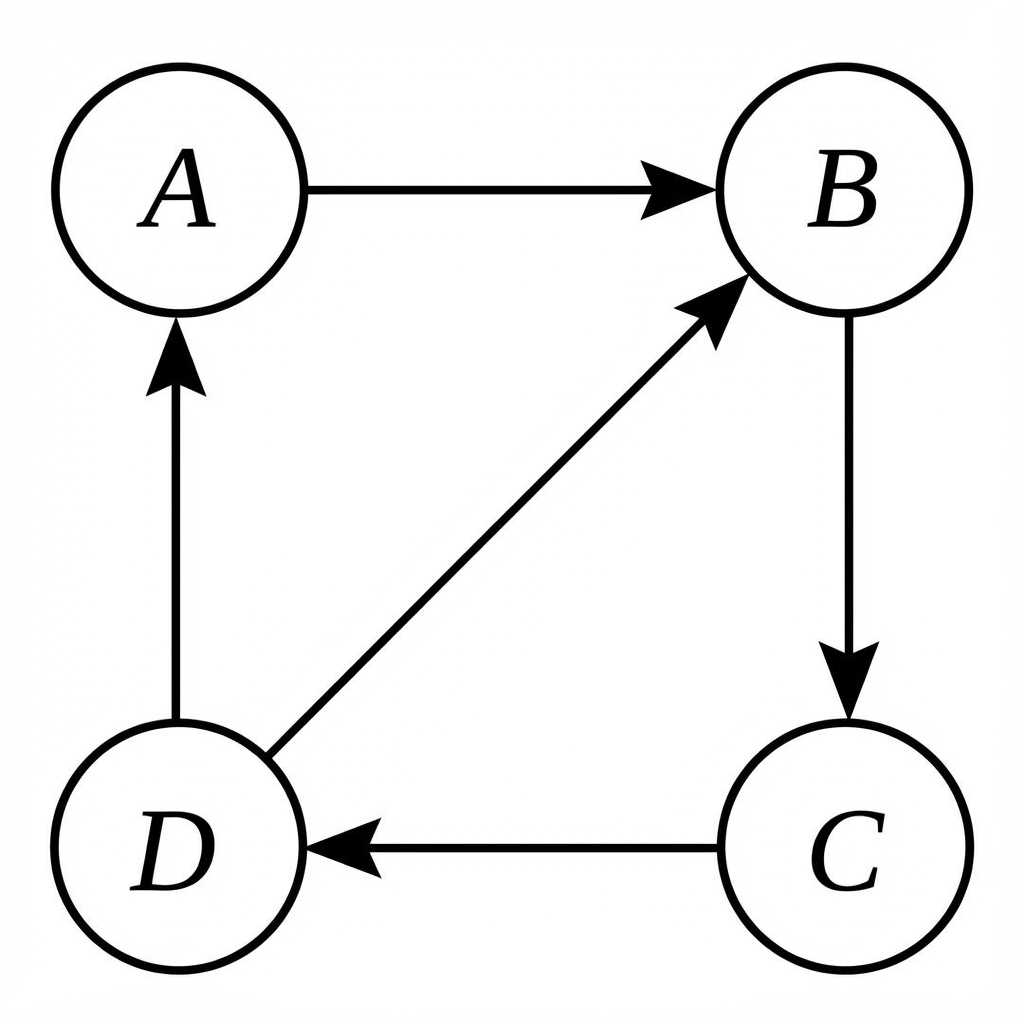
A robot navigates a system with four states , connected as follows:
The robot moves with equal probability to each connected state.
1.[3]
State the transition matrix for this system.
2.[3]
Find the probability of being in state after four transitions, starting from state .
3.[3]
Determine the expected number of steps for the robot to return to state for the first time, starting from state .
Question 10
HLPaper 2
A company has two warehouses, Warehouse X and Warehouse Y. Goods can be transferred between the warehouses or remain in the same warehouse. The transition matrix below shows the probabilities of goods being transferred or staying in the same warehouse.
1.[2]
Given the transition matrix: Draw the transition diagram representing the probabilities of goods being transferred between Warehouse X and Warehouse Y.
2.[3]
If initially 70% of the goods are in Warehouse X and 30% in Warehouse Y, calculate the distribution of goods after one transfer cycle.