Practice AHL 4.12—Data collection, reliability and validity tests with authentic IB Mathematics Applications & Interpretation (AI) exam questions for both SL and HL students. This question bank mirrors Paper 1, 2, 3 structure, covering key topics like core principles, advanced applications, and practical problem-solving. Get instant solutions, detailed explanations, and build exam confidence with questions in the style of IB examiners.
Paper
Level
Question 1
HLPaper 2
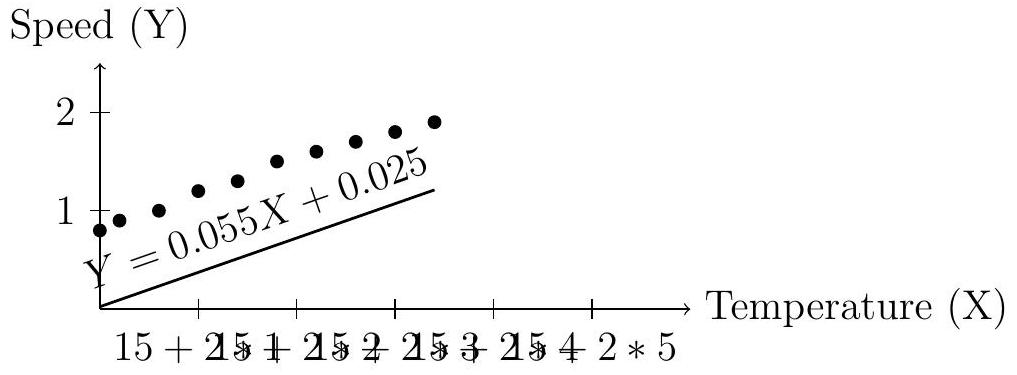
A marine biologist, Raj, investigates whether water temperature ( ) affects the swimming speed (m/s) of a fish species. He observes 10 fish in controlled tanks and records:
| Fish | Temperature (X) | Speed (Y) |
|---|---|---|
| 1 | 15 | 0.8 |
| 2 | 16 | 0.9 |
| 3 | 18 | 1.0 |
| 4 | 20 | 1.2 |
| 5 | 22 | 1.3 |
| 6 | 24 | 1.5 |
| 7 | 26 | 1.6 |
| 8 | 28 | 1.7 |
| 9 | 30 | 1.8 |
| 10 | 32 | 1.9 |
Raj assumes a linear model and tests if the sample mean temperature aligns with an ocean average of . He also checks if speeds are normally distributed.
1.[1]
Name a test to verify normality of swimming speeds.
2.[2]
Calculate the correlation coefficient, .
3.[3]
Conduct a one-tailed test at the significance level for positive correlation. State hypotheses and conclusion.
4.[3]
(i) Find the linear regression equation. (ii) Predict the speed at .
5.[4]
Test if the sample mean temperature differs from at the significance level. State hypotheses and conclusion.
6.[1]
Suggest one way to improve the validity of Raj's study.
Question 2
HLPaper 2
A nutritionist, Clara, investigates whether daily fiber intake (grams) influences energy levels in adults. She surveys 15 adults, recording their fiber intake and energy scores (out of 100) based on a standardized questionnaire. The data is:
| Adult | Fiber Intake (X) | Energy Score (Y) |
|---|---|---|
| 1 | 10 | 60 |
| 2 | 12 | 62 |
| 3 | 15 | 65 |
| 4 | 18 | 68 |
| 5 | 20 | 70 |
| 6 | 22 | 72 |
| 7 | 25 | 75 |
| 8 | 28 | 78 |
| 9 | 30 | 80 |
| 10 | 32 | 82 |
| 11 | 35 | 85 |
| 12 | 38 | 88 |
| 13 | 40 | 90 |
| 14 | 42 | 92 |
| 15 | 45 | 95 |
Clara assumes a linear model and tests if the sample mean fiber intake aligns with a population mean of 25 grams. She also checks for normality of energy scores.
1.[1]
Name a test to verify if energy scores are normally distributed.
2.[2]
Calculate Pearson's correlation coefficient, .
3.[3]
Conduct a one-tailed test at the significance level to determine if fiber intake positively correlates with energy scores. State hypotheses and conclusion.
4.[3]
(i) Find the linear regression coefficients and . (ii) Predict the energy score for a fiber intake of 27 grams.
5.[4]
Test if the sample mean fiber intake differs from 25 grams at the significance level. State the test, hypotheses, and conclusion.
6.[1]
Suggest one method to improve the reliability of Clara's study.
Question 3
HLPaper 2
A farmer claims defective apples in crates of 10 follow . She inspects 100 crates:
| Defective Apples | Crates |
|---|---|
| 0 | 20 |
| 1 | 35 |
| 2 | 25 |
| 3 | 15 |
| 4 | 5 |
1.[2]
Estimate .
2.[6]
Test at significance if the data follows . State hypotheses, expected frequencies, and conclusion.
Question 4
HLPaper 2
A six-sided dice is rolled 60 times, with the following results.
| Outcome | Frequency |
|---|---|
| 1 | 12 |
| 2 | 15 |
| 3 | 13 |
| 4 | 7 |
| 5 | 6 |
| 6 | 7 |
Is there evidence, at the 5% significance level, that the dice is not fair?
1.[1]
State the null and alternative hypotheses for the chi-squared test.
2.[1]
Calculate the expected frequency for each outcome if the dice is fair.
3.[2]
Calculate the chi-squared statistic and p-value for the observed frequencies.
4.[2]
State the conclusion for the test at the 5% significance level. Give a reason for your answer.
Question 5
HLPaper 2
1.
[5]
A six-sided die is rolled 39 times, with the following results.
| Outcome | 1 | 2 | 3 | 4 | 5 | 6 |
|---|---|---|---|---|---|---|
| Frequency | 8 | 3 | 7 | 9 | 5 | 7 |
Is there evidence, at the 10% significance level, that the die is not fair?
Question 6
HLPaper 1
A factory, producing plastic gifts for a fast food restaurant’s Jolly meals, claims that just $1\%$ of the toys produced are faulty.
A restaurant manager wants to test this claim. A box of $200$ toys is delivered to the restaurant. The manager checks all the toys in this box and four toys are found to be faulty.
The restaurant manager performs a one-tailed hypothesis test, at the $10\%$ significance level, to determine whether the factory’s claim is reasonable. It is known that faults in the toys occur independently.
1.[1]
Identify the type of sampling used by the restaurant manager.
2.[2]
Write down the null and alternative hypotheses.
3.[2]
Find the $p$-value for the test.
4.[2]
State the conclusion of the test. Give a reason for your answer.
Question 7
HLPaper 1
A researcher, Omar, studies whether the number of hours spent on meditation per week affects anxiety levels in employees. He collects data from 10 employees:
| Employee | Meditation Hours () | Anxiety Score () |
|---|---|---|
| 1 | 1 | 80 |
| 2 | 2 | 75 |
| 3 | 3 | 70 |
| 4 | 4 | 65 |
| 5 | 5 | 60 |
| 6 | 6 | 55 |
| 7 | 7 | 50 |
| 8 | 8 | 45 |
| 9 | 9 | 40 |
| 10 | 10 | 35 |
Omar assumes a linear model and tests if the sample mean meditation hours align with a company average of 5 hours.
1.[2]
Define what is meant by a criterion-related validity test in this context.
2.[2]
Calculate the Pearson's product-moment correlation coefficient, .
3.[2]
Justify whether meditation hours are a valid predictor of anxiety levels.
4.[3]
(i) Find the linear regression equation of on .
(ii) Interpret the value of in the context of the study.
5.[4]
Test if the sample mean meditation hours differ from the company average of 5 hours at the significance level. State the null and alternative hypotheses, the -value, and your conclusion.
Question 8
HLPaper 2
| Diet Type | 11–13 | 14–15 | 16–17 | 18–19 |
|---|---|---|---|---|
| Vegetarian | 8 | 15 | 8 | 7 |
| Vegan | 20 | 10 | 8 | 6 |
| Meat | 14 | 20 | 6 | 3 |
1.[2]
State suitable hypotheses for a test for independence.
2.[2]
Explain why the last two columns of the table need to be combined.
3.[5]
Conduct a test for independence, using a 5% significance level. State your conclusion in context.
Question 9
HLPaper 2
A dairy farmer, Sofia, believes the number of defective milk bottles in a batch of 10 follows a binomial distribution . She inspects 80 batches and records the results in the following table:
| Number of Defective Bottles | Number of Batches |
|---|---|
| 0 | 25 |
| 1 | 30 |
| 2 | 20 |
| 3 or more | 5 |
1.[2]
Calculate the mean number of defective bottles per batch and estimate the value of .
2.[6]
Conduct a chi-squared goodness-of-fit test at the significance level to determine if the binomial distribution is an appropriate model. State the hypotheses, expected frequencies, and your conclusion.
3.[2]
Explain why combining categories may be necessary when performing a chi-squared goodness-of-fit test.
4.[2]
Without performing further calculations, describe the effect on the degrees of freedom if the value of had been specified by the farmer beforehand rather than estimated from the data.
Question 10
HLPaper 2
1.[2]
The standard deviation, , of a sample size 15 is 13.8. Find .