Practice AHL 2.10—Scaling large numbers, log-log graphs with authentic IB Mathematics Applications & Interpretation (AI) exam questions for both SL and HL students. This question bank mirrors Paper 1, 2, 3 structure, covering key topics like core principles, advanced applications, and practical problem-solving. Get instant solutions, detailed explanations, and build exam confidence with questions in the style of IB examiners.
Paper
Level
Question 1
HLPaper 2
A geologist models the decay of seismic wave amplitude with distance (in km) from an earthquake epicenter, using , where are constants. Data is plotted as against , but due to the exponential term, the graph is not perfectly linear. However, for small , the term , and the plot approximates a straight line through and .
Graph of against
1.[3]
Assuming , find the equation of the line in the form .
2.[2]
Determine and .
3.[2]
If , find an expression for in terms of .
4.[2]
Estimate when , to two significant figures.
5.[3]
Discuss the limitations of the model for large .
Question 2
HLPaper 2
A physicist models the decay of a radioactive substance, where the mass (in grams) remaining after time (in days) is given by , with constants. The physicist plots against and finds a straight line passing through (2, 4.605) and (5, 3.912).
1.[2]
Show that the relationship can be expressed as .
2.[3]
Find the equation of the straight line in the form .
3.[2]
Determine the values of and .
4.[2]
Estimate the mass remaining after 10 days, to two decimal places.
5.[3]
Find the time when the mass is 10 grams, to the nearest day.
Question 3
HLPaper 2
A scientist models the electrical resistance (in ohms) of a conductor as a function of its length (in meters), using . A plot of against is linear through ( 0 , 2.303) and (1, 3.912).
1.[2]
Derive the linearized form of the model.
2.[3]
Find the equation of the regression line.
3.[2]
Determine and .
4.[2]
Estimate the resistance when meters, to three significant figures.
5.[3]
Find the length when ohms, to two decimal places.
Question 4
HLPaper 2
The following data represents the population of a certain species of fish in a lake over a period of 10 years. The population is believed to grow exponentially.
1.
[2]
Construct a table showing the values of Year and , giving your answers correct to 3 decimal places.
| Year | Population |
|---|---|
| 1 | 150 |
| 2 | 220 |
| 3 | 320 |
| 4 | 470 |
| 5 | 680 |
| 6 | 980 |
| 7 | 1400 |
| 8 | 2000 |
| 9 | 2900 |
| 10 | 4200 |
2.[2]
Find the equation of the regression line of on Year.
Question 5
HLPaper 2
A chemist studies the rate of a reaction as a function of concentrations and of two reactants, modeled by . The following data is collected:
| 0.301 | 0.477 | 2.079 |
| 0.602 | 0.301 | 2.505 |
| 0.903 | 0.602 | 3.408 |
1.[2]
Show that .
2.[3]
Set up a system of equations to find , , and .
3.[3]
Solve for , , and .
4.[2]
Predict the rate when and , to three significant figures.
Question 6
HLPaper 2
The force, newtons, between two magnets a distance metres apart is modelled by the equation . The following measurements were taken:
1.[2]
Linearize the relationship between and using the given model .
2.[2]
Use linear regression to find the values of and , giving your answer to two significant figures.
Question 7
HLPaper 2
Consider a dataset that represents the growth of a bacterial culture over time. The number of bacteria at time (in hours) is recorded. The data is suspected to follow an exponential growth pattern.
1.[4]
Given the data points: , , , , use logarithms to linearize the data and determine the relationship between and .
2.[3]
Interpret the linearized graph and determine the parameters of the exponential model.
Question 8
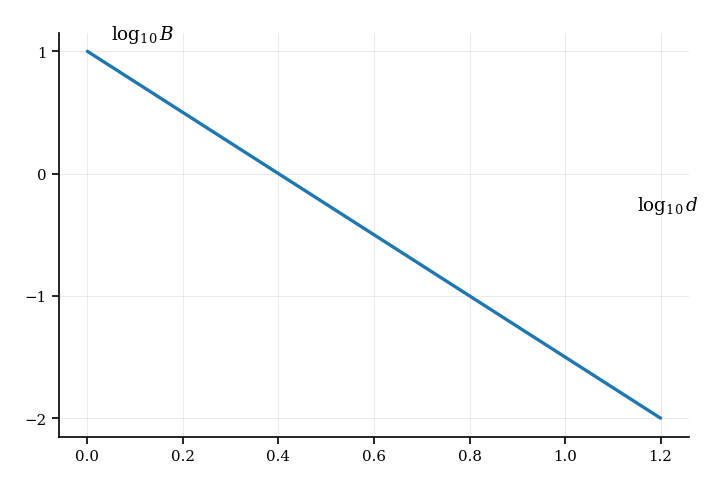
HLPaper 1
It is believed that two variables, and , are related by the equation , where . Experimental values of and are obtained. A graph of against shows a straight line passing through and .
1.[4]
Find the value of and of .
Question 9
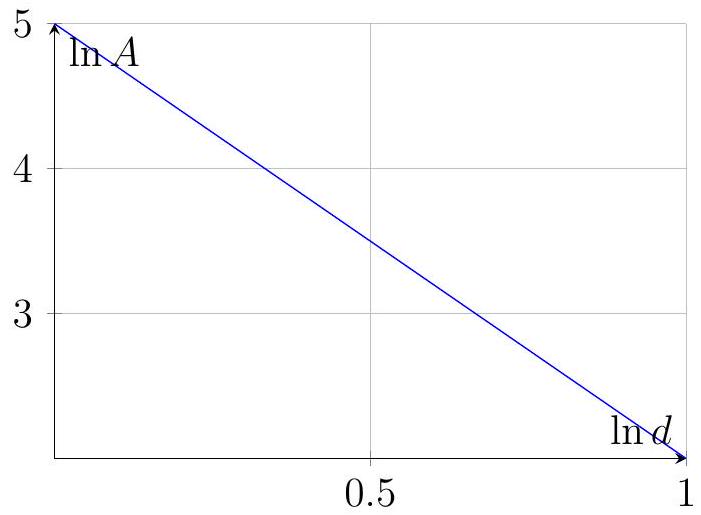
HLPaper 2
The brightness of a star, measured in arbitrary units, is believed to be related to its distance (in light-years) from Earth by the formula , where and are positive constants. An astronomer plots against and obtains the following graph:
Graph of against
1.[2]
Explain why the graph confirms the proposed model for .
2.[2]
Determine the equation of the regression line in the form .
3.[3]
Find the values of and .
4.[2]
Estimate the brightness when light-years, to three significant figures.
5.[3]
Discuss the validity of using this model for very large distances, such as light-years.
Question 10
HLPaper 2
A researcher models the heat transfer rate (in ) through a material as a function of its thickness (in cm), using . A plot of against is a straight line passing through and .
1.[2]
Derive the linearized form of the model.
2.[3]
Find the equation of the line.
3.[2]
Determine the values of and .
4.[2]
Predict when , to three significant figures.
5.[3]
Find the thickness when , to two decimal places.